Curve Fit
This tab enables you to fit several function types into newly generated data points or depending on a given dataset. The algorithm will determine the best matching parameters for your data.
Note
This tutorial assumes that you already selected a project and imported data. For more information see Import Data. Furthermore you need to select the data in the Content-Window (Right Bar).
Basic Usage
Setting up a fit operation can be done in the following steps:
By chunk width:
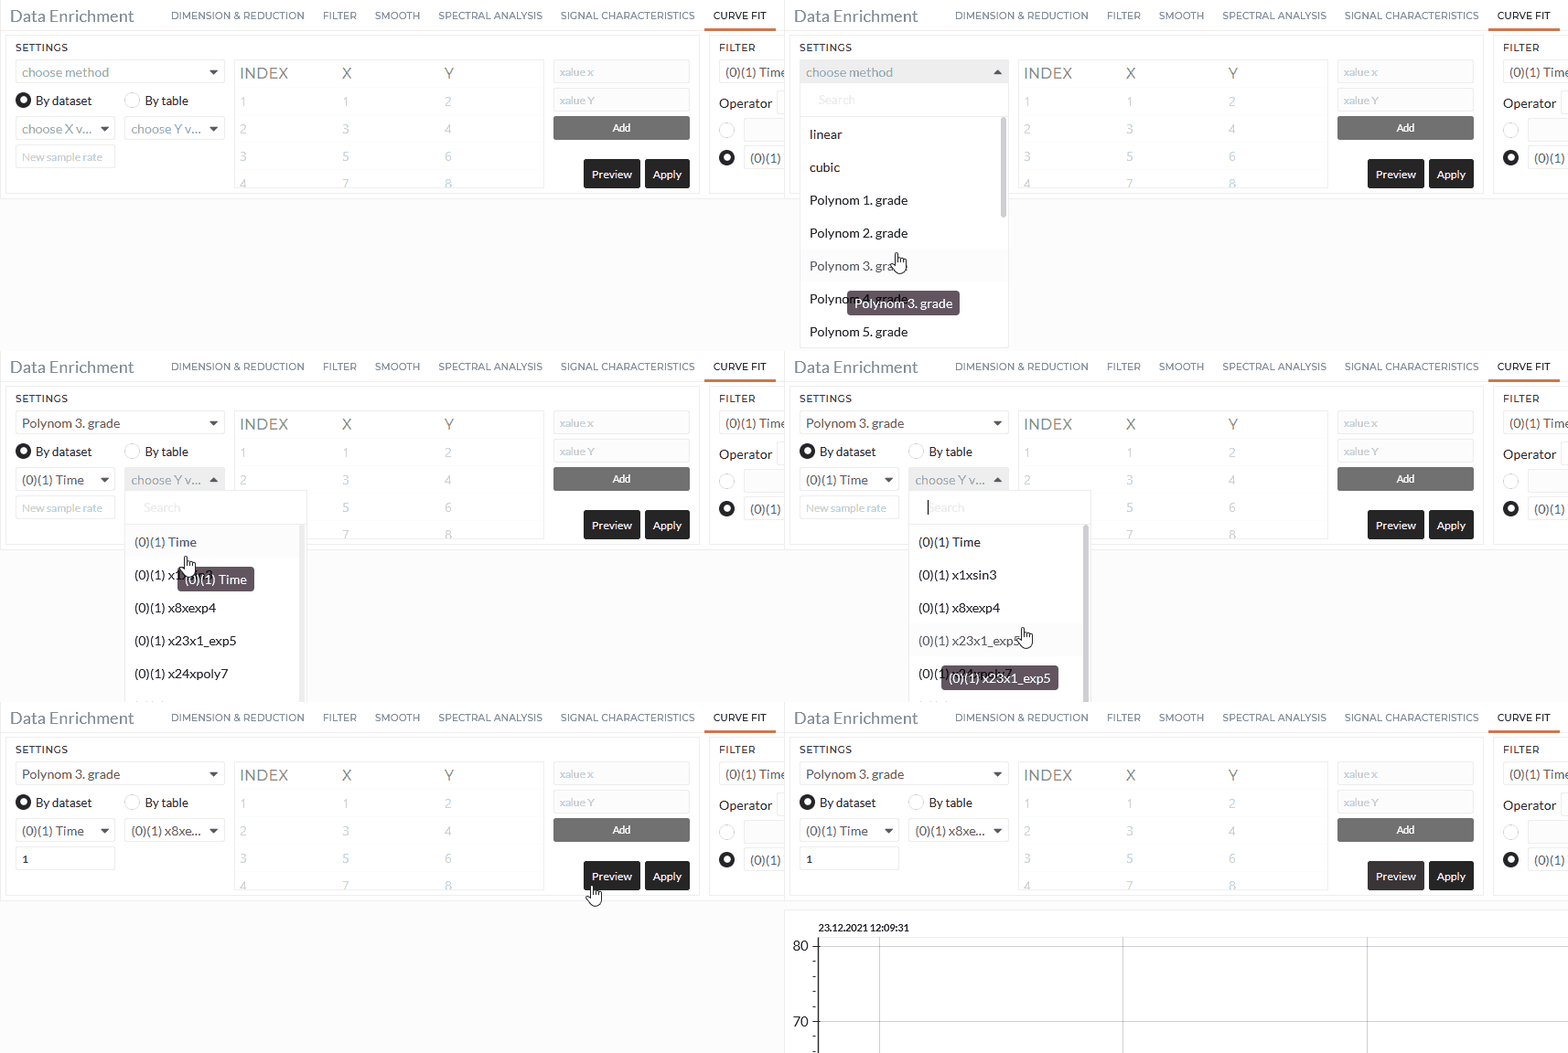
In the case of fitting to a given dataset - "by dataset": 1. Choose the function you want to fit. 2. Select the dataset - one selection for the x-axis and one selection for the y-axis 3. define a new sampling rate
In the case of fitting to a given dataset - "by table": 1. Choose the function you want to fit. 2. Modify, extend, or shrink the datapoint in the table. You can change the data by double-clicking in the table or delete the row by clicking the "delete" button on your keyboard. If you want to add more data points you can add them with the "Add" button. 3. define a new sampling rate
An optimization solver is performed, and the operation will return the old dataset, a newly generated dataset with the new sampling rate, and the accuracy of the fitting. The initial parameter guess is random. It might be that the algorithm returns different results even if the input remains the same.
The following animation shows an example usage.

Filter
As in all Data Enrichment Tabs, you can select only a part of the data by using a Filter. A more detailed description of Filters can be found here
Preview / Apply
To preview the changes due to this operation, select Preview and see the new data set in the viewer area. If you want to apply these changes permanently, select Apply. For a more detailed description, see Starting a Job.