Time Series Forecasting
The time series forecasting tab is for predicting future data based on previous data points. You can use previous time-series data to make the forecast. You can also use historical features and future features if available. There is also an option to train on multiple time series data together and predict.
This tutorial assumes that you have already selected a project and imported data. For more information please visit on Project and Import Data section.
User Interface Structure
This section will help to familiarize with the Time-Series-Forecasting TAB interface elements.
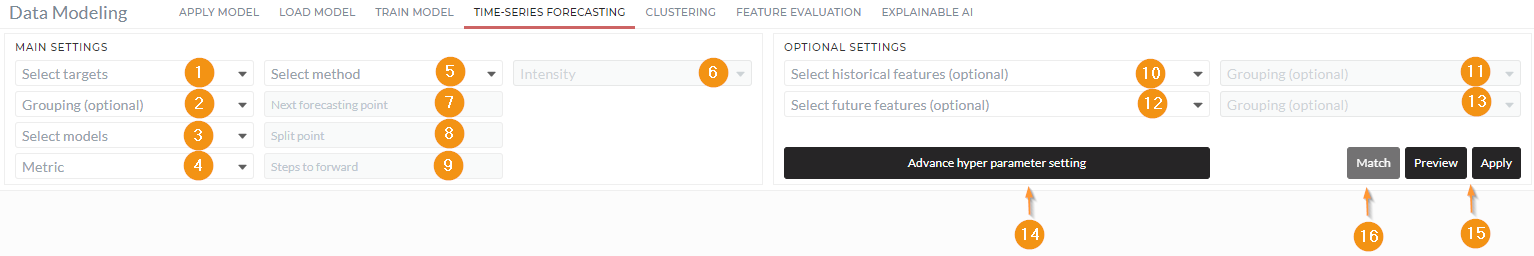
The primary prerequisite of the Time-Series-Forecasting TAB is that all the selected signals here always should be Time-series data (i.e., value-vector pair)
1. Select targets
The target signal has to select here. It's a multi-select drop-down. As this is time-series data, the time will be automatically attached here.
2. Grouping
For multi-series forecasting, here you can select the categorical group column. It is a multi-select drop-down. That is an optional setting.
To understand why we need grouping, I will explain some details here: For example, we have data on Primark sales amount for the whole of Germany for the last three years. Also, we have sales data of 16 individual states for the last three years, which means 16 individual time series for the last three years for 16 states. If we want to forecast each state separately, you can select one categorical column of states' names in the grouping. It has to be the same length as the combined data of 16 states. Then our platform will automatically consider all 16-time series separately and forecast separately for 16 states.
3. Select models
You can select all the available algorithms here. It is a multi-select drop-down. The complete list of available models is available in the Reference section.
4. Select metric
You can select from the available metric to calculate the score. The full list of available metrics is available in the Reference section.
5. Select methods
You can select from the available methods to calculate the score. The full list of available methods and descriptions is in the Reference section.
6. Intensity
This option is only available if the selected method is either Grid-search or Grid-search forecasting. You can select any parameter intensity here.
7. Next forecasting point
This option is only available if the selected method is : Forecasting or Basic split test forecasting or Back-testing forecasting or Grid search forecasting. You can choose the number of points you want to predict.
8. Split point
This option is available for all selected methods except Forecasting. You can provide integer, fraction, or DateTime value here.
If an integer is given, then after that number of points, the data will be used as test data, and before that point, the data will be train data. Fraction (float value) will be used as a split fraction of train test data. If the DateTime value is given, then after that point, the data will be used as test data, and before that date, the data will be train data.
9. Step forward
This value is only required during the back-testing method. It indicates how many steps to go forward in each iteration of testing. To know more about back-testing, you can read this article
10. Select historical features
This is an optional drop-down column to select historical features. It can be single-select or multi-select. Generally, these features' length is the same as the target's.
11. Select future features
This is an optional drop-down column to select future features. It can be single-select or multi-select. Generally, the timestamp of future features starts after the end timestamp of the target.
12. Select historical features grouping
This is an optional drop-down column for grouping the historical features when grouping is enabled in the main settings. Each grouping signal length will be equal to the corresponding historical feature length.
13. Select future features grouping
This is an optional drop-down column for grouping future features when grouping is enabled in the main settings. Each grouping signal length will be equal to the corresponding future feature length.
14. Advance hyper-parameter setting
In this section, you can change the default setting of each model parameter setting. Depending on your selected model and method, the default parameter set will open, and then you can change them according to your choice. Without proper knowledge and setting the wrong set of parameters can lead to operational error.
16. Match
This option will only activate if you have selected historical and future features. As there can be name dissimilarity in historical and future features, the user can indicate the matching of the corresponding signal.
The following sections assume you already know how to use the time series tab. If not, please learn how to use the time series tab from the above section.
Basic split test
Here we will do all the steps of the Basic split test of water flow:
- First, select the time-series data that you want to forecast.
- Then select the model that you want to use.
- Next, choose the metric to evaluate the result.
- Choose the desired method. I have selected the Basic split test.
- For this method, I need to select and Split point = 0.9
- I have changed nothing in the advanced parameter setting and kept the default value.
- Click Preview/Apply
The following animation shows the way of basic split test:
Forecasting target with historical and future features
It is almost the same as above, but you can give additional historical and future features.
- First, select the time-series data that you want to forecast.
- Then select the model that you want to use.
- Next, choose the metric to evaluate the result.
- Choose the desired method. I have selected Basic split test and forecasting.
- For this method, I need to select Next forecasting point = 8 and Split point = 0.9
- I have changed nothing in the advanced parameter setting and kept the default value.
- In Select historical features, I have selected two historical features named rainfall and melting from different folders.
- In Select future features, I have selected one known future feature named rainfall from the third folder.
- Click Preview/Apply
The following animation shows the way of basic split test and forecasting with historical and future features:
Forecasting different groups of target
Here we will do all the steps to forecast the flow of water for the next ten days.
- First, select the time-series data that you want to forecast.
- Selected the column that defines the group of the target.
- Then select the model that you want to use.
- Next, choose the metric to evaluate the result.
- Choose the desired method. I have selected Basic split test and forecasting.
- For this method, I need to select Next forecasting point = 10 and Split point = 0.9.
- I have changed nothing in the advanced parameter setting and kept the default value.
- In Select historical features, I have selected two historical features named rainfall and melting from different folders.
- I have selected the corresponding group column in Grouping near Select historical features.
- In Select future features, I have selected one known future feature named rainfall from the third folder.
- I have selected the corresponding group column in Grouping near Select future features.
- Click Preview/Apply
The following animation shows the way of basic split tests and forecasting:
References
-
Models: The background and details information on Time-series models can be found here. The implemented models list is given below:
- NBEATSModel
- RandomForest
- LightGBM
- GB
- BayesianRidge
- Ridge
- SVR
- RNNModel
- BlockRNNModel
- TCNModel
- Prophet
- FourTheta
- ARIMA
- AutoARIMA
-
Metric: The background and information about matrics can be found here. The implemented metric list is given below:
- Mean Absolute Percentage Error (MAPE)
- Mean Absolute Error (MAE)
- Mean Absolute Scaled Error (MASE)
- Accuracy (R2-score)
- Root Mean Squared Log Error (RMSLE)
- Symmetric Mean Absolute Percentage Error (sMAPE)
-
Methods: The implemented methods list is given below:
- Forecasting: In this method platform will only do the forecasting by giving Next forecasting point
- Basic split test: In this method, the platform will split the given percentage's data and then forecast the test.
- Basic split test and forecasting: In this method platform will split the data of the given percentage and then forecast the test part. Then additionally forecasting of giving Next forecasting point.
- Backtesting: More about backtesting can be found here and here
- Back-testing and forecasting: This method also performs forecasting in addition to back-testing.
- Grid search: This method will do a grid search to find the best parameter set.
- Grid search forecasting: This method will do a grid search to find the best parameter set and forecasting.