Math & Logical
In this TAB, you can perform many different mathematical operations, to modify your data. Such operations can be the application of trigonometrical functions or the calculation of statistical quantities. Furthermore, you can compare data using logical operators.
Note
This tutorial assumes that you already selected a project and imported data. For more information see Import Data.
Basic Usage
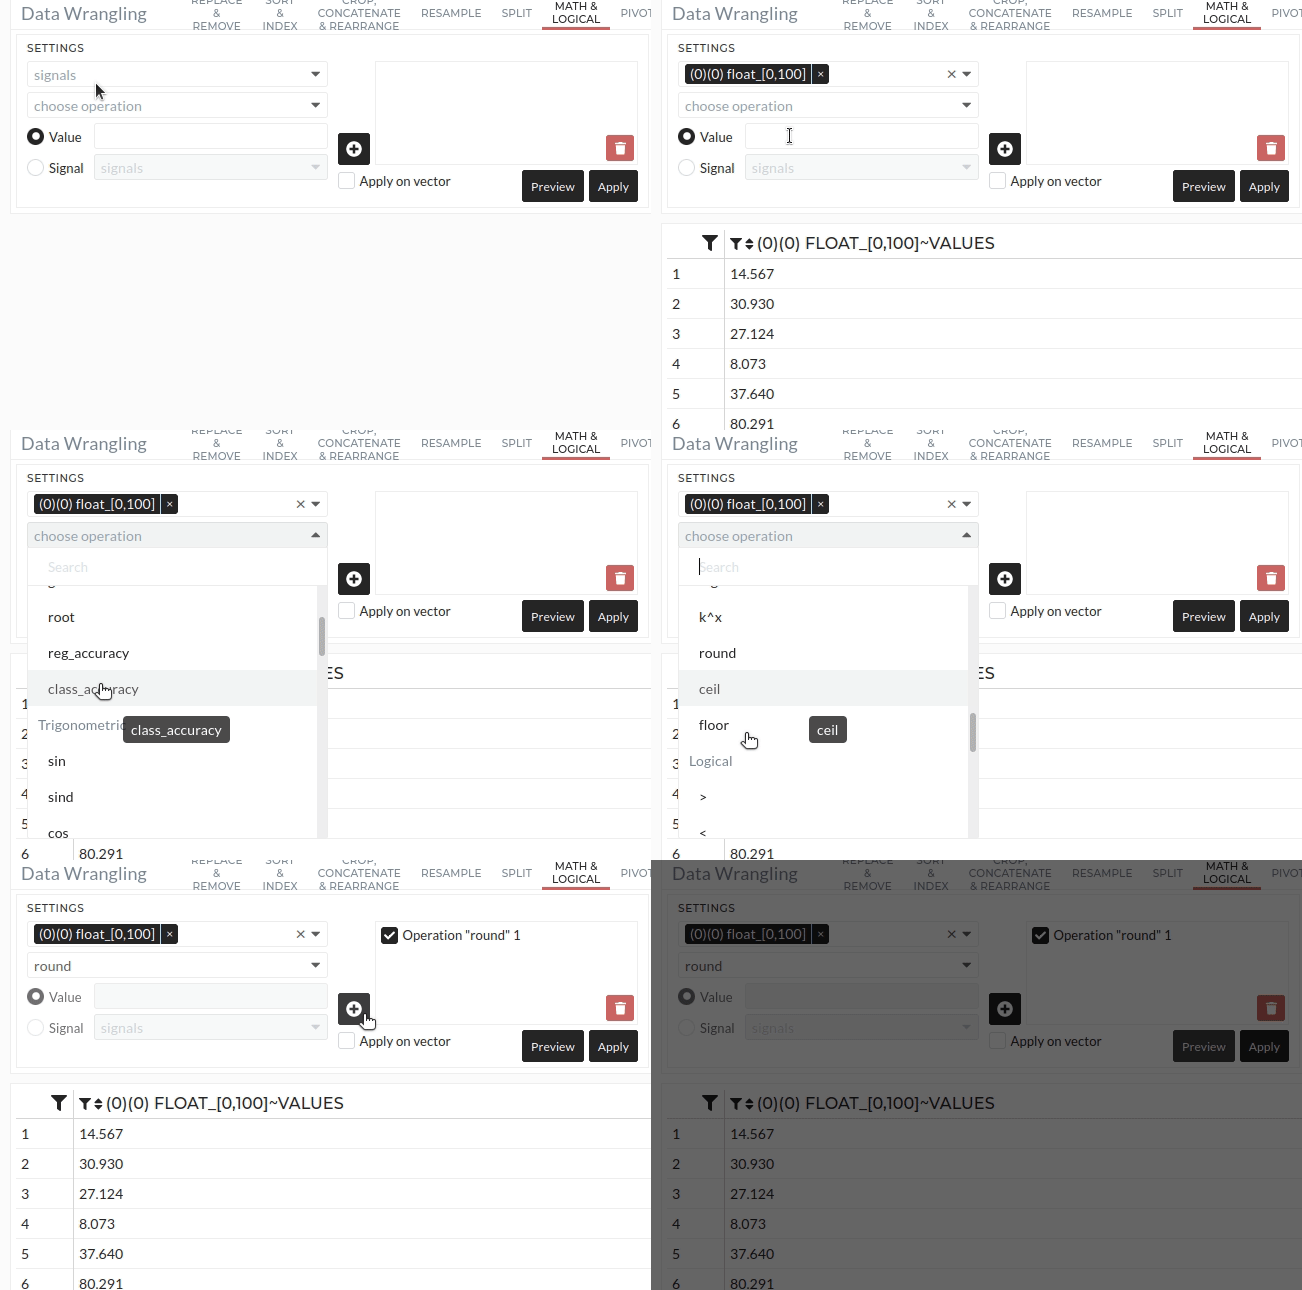
In this example, we round all given floats to the next integer using the Round method. Therefore we follow these steps:
- Select input signals
- Choose method to apply
- Choose value or signal to perform the operation with (e.g. which value to add to input signal)
- Apply operation
For example, we can round all floats to the next integer in an efficient way, as shown in the following animation:

References for Methods
Here we give a detailed description of every available function within this TAB.
Miscellaneous Methods
This is a collection of various functions.
- none - : No operation
- Trapezoidal Integration - Integrates the signals using the Trapezoidal Rule
- Cummulative Trapezoidal Integration - Integration using the cummulative Trapezoidal Rule and initial value of 0.
- Cumulative Sum -
- Difference - Calculates the difference between neighboring values, i.e. x[i+1] - x[i]
- Gradient - Gradient of the signals. You need to give the spacing of the values in the Value-field.
- Square Root - Takes the Square Root of all values
- Round - Rounds floats to their next Integer if the value is not set. If the value is given, it is rounded to the given number of decimals. For example, 5.3454 will be rounded to 5.35 if the value is set to 2.
More information on the Trapezoidal Integration Rule see here: https://numpy.org/doc/stable/reference/generated/numpy.trapz.html More information on the cummulative Trapezoidal Integration Rule see here: https://docs.scipy.org/doc/scipy-0.14.0/reference/generated/scipy.integrate.cumtrapz.html More information on the Accuracy Functions see here: https://scikit-learn.org/stable/modules/generated/sklearn.metrics.r2_score.html
Regression Metrics
Based on target signal and predicted signal, we can calculate the following metrics: - R2 Score - Calculates the R2-score. - MAE - Calculates the Mean Absolute Error. - MSE - Calculates the Mean Squared Error. - RMSE - Calculates the Root Mean Squared. - Median Absolute Error - Calculates the Median Absolute Error.
Classification Metrics
Based on target signal and predicted signal, we can calculate the following metrics: - Accuracy - Calculates the Accuracy. - Balanced Accuracy Score - Calculates the Balanced Accuracy Score. - F1 Score - Calculates the F1-score. - Precision Score - Calculates the Precision score. - Recall Score - Calculates the Recall score. - Jaccard Score - Calculates the Jaccard score.
Trigonometric Functions
- Sin / Cos / Tan - Calculates the trigonometric function directly from the input signals and assumes radians as input.
- Sin / Cos / Tan from Radians - Converts input signals from Radians to Degrees first and the calculates Trigonometric Function.
Arithmetic Methods
A collection of Arithmetic Functions. Most of them need an additional value or signal given in the corresponding fields.
- + , - , * , / - Performs the chosen arithmetic function on the input signal and the additional value or signal.
- x^k - Takes the k-th power of the input x, where k can be a value or signal given in the additional fields.
- log - Calculates the natural logarithm (basis of e) of every value
- k^x - Takes k to the power of x, where k is a value of signal given in the additional fields.
- ceil - Rounds all floats up to the next higher Integer
- floor - Round all floats down to the next lower Integer
Logical Methods
Here you can compare your input signal to a given value or reference signal. Each value is compared to the comparison value. If the expression evaluates to true, the value in the result will be 1.0. Otherwise it will be 0.0.
- < / > / <= / => - Greater or Less (equal) comparison
- isEqual - Exact comparison to given value / signal
Statistical Methods
Multiple statistical functions. The functions that have a Column in the prefix, do not need any additional value or signal. The first functions max/min/mean compare row-wise the input values to the reference value / signal. Thus these function require an additional value or signal.
- Max/Min/Mean - Row-Wise Calculation of two values.
- Column Sum/Mean/Min/Max/Std - Calculating the quantity along the column (2nd axis)
- Column Quantile XX% - Returns the Quantile of given percentage along the column, i.e. the value under which XX% of the datapoints are.
Filter
As in all DataWrangling Tabs, you can select only a part of the data using a Filter. A more detailed description of Filters can be found here
Preview / Apply
Select Preview and see the new data set in the viewer area with the changes due to this Operation. If you want to apply these changes permanently, select Apply. See Starting a Job.