Pivot
This TAB enables you to Pivot their data according to their requirements. A pivot table is a table of grouped values aggregating a more extensive table (such as from a database, spreadsheet, or business intelligence program) within one or more discrete categories. This summary might include sums, averages, or other statistics, which the pivot table groups together using a chosen aggregation function applied to the grouped values [source]. In addition to standard Pivoting, this TAB also enables you to consider different Datetime related intervals when a time-based additional reference is available. The full list of Time interval and operation is available in Reference section.
This tutorial assumes that you already selected a project and imported data. For more information please visit on Project and Import Data section.
User Interface Structure
This section helps to familiar with the Pivot TAB TAB interface elements.
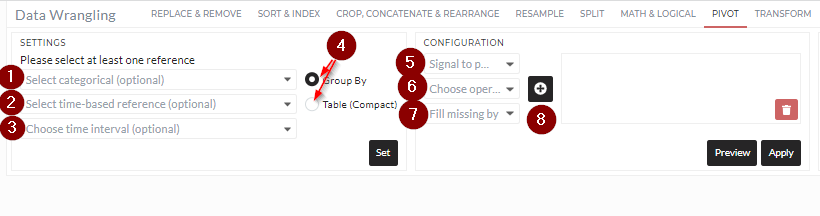
1. Select Categorical (optional)
Select categorical data here and multi-select possible. It is an optional requirement for pivoting.
2. Select time based reference (optional)
Select the Time based data if it is available. It is also an optional requirement. You can skip if you do not have any time-based data.
Important note: Although both points 1 and 2 are optional, you need to select at least one of them. You can choose both points one and two together also.
3. Choose time interval (optional)
Here, you can select the time interval of the output result if you select the time-based signal in point 2. Meaning of different Time interval is available in Reference section. It is an optional setting.
4.Pivot output method
- You must select how they want to pivot. There are two options available,
Group by: The result will be grouped depending on the selected categorical and time-based reference columns.
- Table(compact): The output table is according to the standard compact pivot table.
5. Signal to Pivot
Select the data (multi-select possible) that you want to pivot.
6. Choose operation
Select what type of operation you want to apply on the data selected on point 5. A complete list of operations is available in the Reference section.
7. Fill missing value
Select how you want to fill the missing value after Pivot is completed.
8. Click on plus(+)
For each selected data in point 5 and their corresponding operation and fill missing value, you need to click plus(+) sign to add them in the box.
9. Preview/Apply
Preview button will do the operation but will not save the data, while Apply will give you the option to save the data in a folder in content. More information is available in here
Basic Usage
Using different Pivot operations is simple and always follows the same rules. The following image explains the usage of the Pivot operation:
- Choose one reference data Categorical, which is is an optional selection.
- Choose Time-based Reference if available.
- If Time-based Reference reference is selected, you can select Time-interval.
- Choose a method between 1. Group by 2. Table(compact).
- Select the data where the Pivot operation will execute.
- Select Operation and Fill missing value for each selected data.
- Click the add button.
- Preview/ Apply operation.
Below two seperate animation shows two different types of Pivoting:
Pivot without time-based reference selected
Pivot with time-based reference selected
Filter
In all DataWrangling Tabs, you can select only a part of the data using a Filter. A more detailed description of Filters is available here
References
Below you can read about the meaning of different options in Time-interval:
- ** Minutely: This will resample and sort the Time-based Reference data in minutes. The final number of the output row will be high because of the minute resample.
- ** Minutely total (fix 60|1-60): The data in Time-based Reference will be resampled in a maximum 60 (1-60) fixed value. After the operation, the result will be only one value for each minute value.
- ** Hourly: This will resample and sort the Time-based Reference data in hours. The final number of output rows will be in the range of the Time-based Reference column, where the sampling frequency is an Hour.
- ** Hourly (fix 24|1-24): The data in Time-based Reference will be resampled in a maximum 24 (1-24) fixed value. After the operation, the result will be only one value for each hour value.
- ** Daily: This will resample and sort the Time-based Reference data daily. The final number of output rows will be in the range of the Time-based Reference column, where the sampling frequency is a Day.
- ** Daily (fix 31|1-31): The data in Time-based Reference will be resampled in a maximum 31 (1-31) fixed value. After the operation, the result will be only one value for each Day value.
- ** Weekday-based: This will resample and sort the Time-based Reference data on weekdays. There will be seven different (Saturday-Friday) pivoted values after the operation every month.
- ** Weekday-based (fix 7|1-7): The data in Time-based Reference will be resampled in a maximum 7 (1-7) fixed value. After the operation, the result will be only one value for each Weekday value.
- ** Weekly: This will resample and sort the Time-based Reference data in calendar-week. The final number of output rows will be in the range of the Time-based Reference column, where the sampling frequency is Calender-week.
- Weekly (fix 51|1-52): The data in Time-based Reference will be resampled in a maximum 52 (1-52) fixed value. After the operation, the result will be only one value for each Calander-week value.
-
** Monthly: This will resample and sort monthly the Time-based Reference data. The final number of output rows will be in the range of the Time-based Reference column, where the sampling frequency is a Month.
-
** Monthly (fix 12|1-12): The data in Time-based Reference will be resampled in a maximum 12 (1-12) fixed value. After the operation, the result will be only one value for each month.
-
** Quarterly: This will resample and sort quarterly the Time-based Reference data. The final number of output rows will be in the range of the Time-based Reference column, where the sampling frequency is a Quarter.
-
** Quarterly (fix 4|1-4): The data in Time-based Reference will be resampled in a maximum 4 (1-4) fixed value. After the operation, the result will be only one value for each month.
- ** Yearly: This will resample and sort the Time-based Reference data yearly. The final number of output rows will be in the range of the Time-based Reference column, where the sampling frequency is a Year.
Below you can know about the different operations:
- **mean ** Mean aggregation of each grouped data.
- **min: ** Minimum collection of each grouped data.
- **max: ** Maximum collection of each grouped data.
- **median: ** Median of each grouped data.
- **sum: ** Summation of each grouped data.
- **count: ** Counting number of elements in each grouped data.
- **range: ** Range of each grouped data.
- **time range: ** Time range of each grouped data. Only applicable if the data is in DateTime
- **quantile 25%: ** Quantile 25 value in each grouped data.
- ** quantile 75%: ** Quantile 75 value in each grouped data.