Feature Extraction
This TAB enables you to extract essential characteristics from a time series data called features. Many features in Time and Frequency domains calculate automatically.
Most of the datasets are intense high resolution in industrial predictive maintenance cases. It isn't easy to use raw data directly in machine learning algorithms. That is why it is necessary to prepare a feature matrix from raw data where each row will contain important information related to the portion of the raw data. In the Time domain, you can extract features from Raw signal or Absolute, Gradient 1, Gradient 2 of the Raw Signal.
User Interface Structure
The use of Feature Extraction is complex, and you need to understand each step carefully to utilize this TAB completely. This section helps to familiar with the frequency Feature Extraction TAB interface elements.
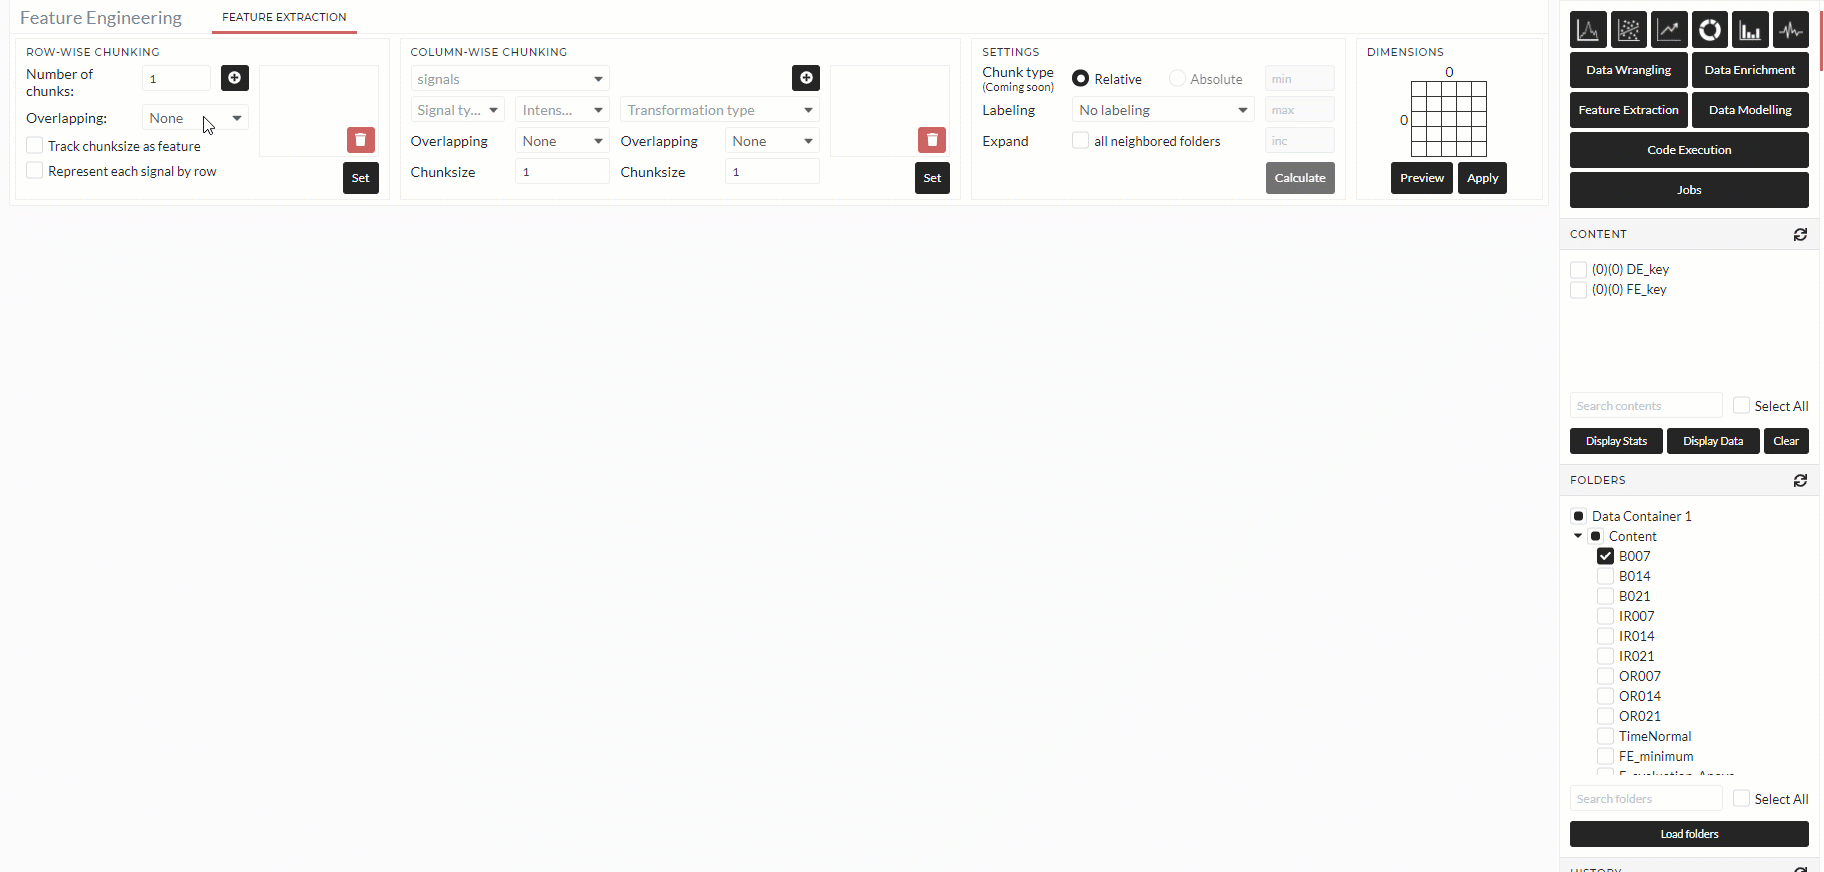
Row-wise chunking:
The setting of this block is to decide the row's chunking and the output format.
Step by step usage of row-wise chunking of feature extraction
- chunk number: You can specify the number of chunks here. Then each selected signal will be chunked and created the same number of new rows. In the below-animated example, each signal has 16 samples, and the chunk number is two, and the resulting output will have two rows. chunk width: Like chunk number it will also create rows. But this time, the chunk width will be the number of samples in each chunk. For example if chuk width is 50, then the first chunk will contain the first 50 samples, the second chunk will contain the next 50 samples, and so on. So, if a signal contains 100 samples, and chunk width is 50, then the resulting output will have 2 rows.
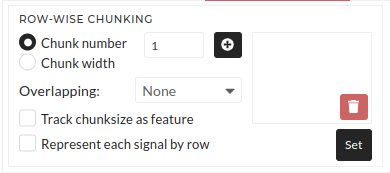
- overlapping: You can mention overlapping percentage at chunking. It will then increase the number of rows. For example, if 50% overlapping has is selected in the below example, the output row would have three instead of two. Too much unnecessary overlapping may generate an overfitting problem in final data modeling. Overlapping is necessary if there is a fear that some edge data or edge behavior may lose if we do only chunking.
- Track chunk size as feature: As the name suggests, it just tracks chunk size and is mainly deleted in the final data modeling steps.
- Represent each signal by row: As the name suggests, all signal chunked output in the same column will be put under another row. In the below-animated example, the resulting output becomes two columns to one column when this option is checked-out.
Example of Row-wise chunking of Feature extraction.
Column-wise chunking
The setting of this block is to decide the columns's chunking and the type of extracted features.
Step by step usage of column-wise chunking of feature extraction
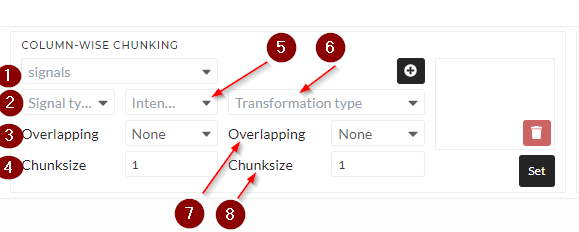
- ** signal**: You need to select the dataset (signals) from which the features extract. It can be single-select or multi-select.
- Signal type: The needs to specify which version of signals to use for further calculations. Options are:
- raw: The signal without any change.
- abs: If this one is selected, then the absolute value of the raw signal will be used for further calculations.
- gradient 1: If this one is selected, then the first-order gradient value of the raw signal will be used for further calculations
- gradient 2: If this one is selected, then the second-order gradient value of the raw signal will be used for further calculations
- overlapping: In column-wise chunking, you can mention overlapping percentages.
- Chunksize: Each segment of row-wise chunking (from the previous section) will be chunked here depending on the given chunk size. The row number will remain the same, but the number of columns will increase.
- Intesity: You can define how many features you want to extract. There are predefined feature profiles like Minimum, Medium, Full, string (only if the signal content is a string), and Datetime (only if signal content is Datetime). You can also choose All features or only selected features according to their choice
-
Transformation type: You can select the domain you want to extract features. Options are:
- None: If the none is selected, then it will extract features on the time domain depending on the signal type you have selected on number 2 points in this section
- psd: If the psd is selected, it will extract features on Power spectral density (psd) converted frequency domain signal depending on signal type you have selected on number 2 points in this section.
- fft: If the fft is selected, it will extract features on Fast Fourier Transform (fft) converted frequency domain signal depending on signal type you have selected on number 2 points in this section.
- wavelet-dwt: If the wavelet-dwt is selected, it will extract features on Discrete Wavelet Transform (dwt) converted frequency domain signal depending on signal type you have selected number 2 points in this section.
- wavelet-cwt: If the wavelet-cwt is selected, it will extract features on Continuous Wavelet Transform (cwt) converted frequency domain signal depending on signal type you have selected number 2 points in this section.
-
overlapping: This overlapping works on last chunking.
- ** Chunksize: This chunking works if the Transformation Type is only not none and you want to chunk the transformed signal further. Be aware that the final column number increase depending on this chunk size and multiplication of chunk size from point 3.
Final settings and feature matrix size
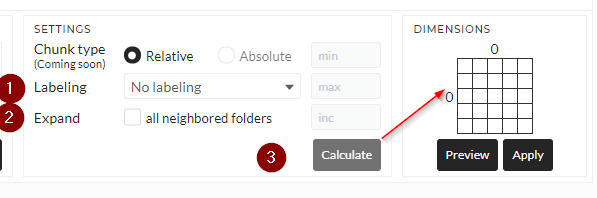
The setting of this block is to decide labeling and feature matrix size calculation.
-
labeling: At the time of different chunking and overlapping labeling also needs to track. Available options are:
- No labeling: The will be no labeling at the output.
- Count by measurement: It marks the individual measurement (we can say folder also) number as the label
- Count by chunking: It marks each chunking number as a label
- ** Count by measurement and chunking**: It will mark individual chunking in each measurement, increasing depending on measurement number.
- Signal name: It will mark each signal name as a label
-
Expand: This will expand the calculation to all neighbor folders.
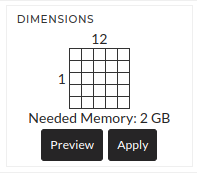
- Calculate: It will calculate only the dimension and show in the matrix shown in the arrow. It will help to understand the final dimension before doing a complete calculation using Preview/Apply. Also, it will show the needed memory size for the current configuration like shown in the below matrix.
Basic Usage
To understand the workflow of Feature Extraction TAB below, I will show one animation and explain those steps:
- Select setting on Row-wise chunking settings.
- Select signals and type of operation
- Select a list of features to extract.
- Select column-wise chunking and corresponding values.
- Select transformation type and corresponding chunking value.
- Click plus(+) for each group settings.
- Click set.
- Select labeling type.
- Mark the expanding box if you want to expand the calculation in all selected folders.
- Click calculate to preview the dimension.
- Finally, click on Preview/Apply.