Counting-based Viewer
In this Viewer, you can use common counting methods, such as counting how often a certain threshold has been crossed or the dwell-time-counting within specific conditions, to get an overview of your data. Generally, the data in the viewer is not modified, or new data is created. However, you may like to export tables created in some viewers or write them into the database as new data points. Further details are in the Basic Usage section.
Note
This tutorial assumes that you already selected a project and imported data. For more information see Import Data. Furthermore you need to select the data in the Content-Window (Right Bar).
Basic Usage
The Counting-based Viewer has three options "By crossed value”, "Based on dwell time detection" and "Based on rainflow detection". Each of the options will be explained separately in the following sections:
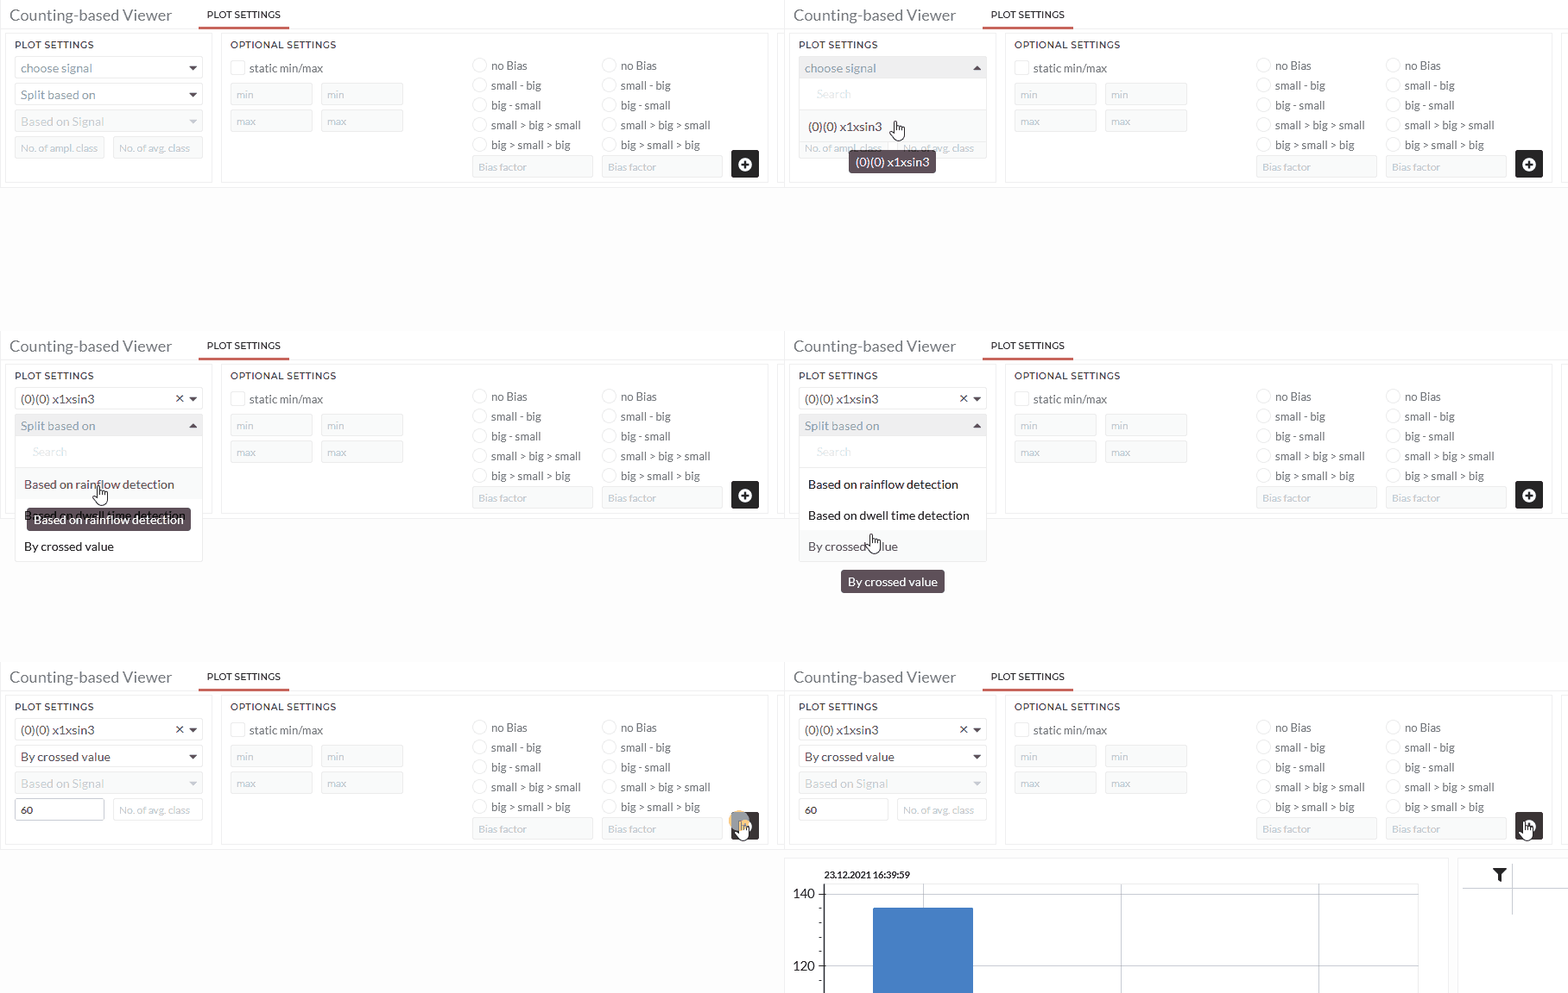
By crossed value:
This option is simply counting how often a certain threshold has been crossed. At the same time, it calculated the average slope while exceeding the threshold or by falling below.
- Choose dataset in the choose signals field.
- Select the counting option By crossed value
- Type the threshold value.
The optional settings will not affect this option.

As a result, you will see a bar chart with the total number of crosses the threshold and separately counted with positive and negative slopes. You can see the total number of counts in the table and the average slope while exceeding or falling below.
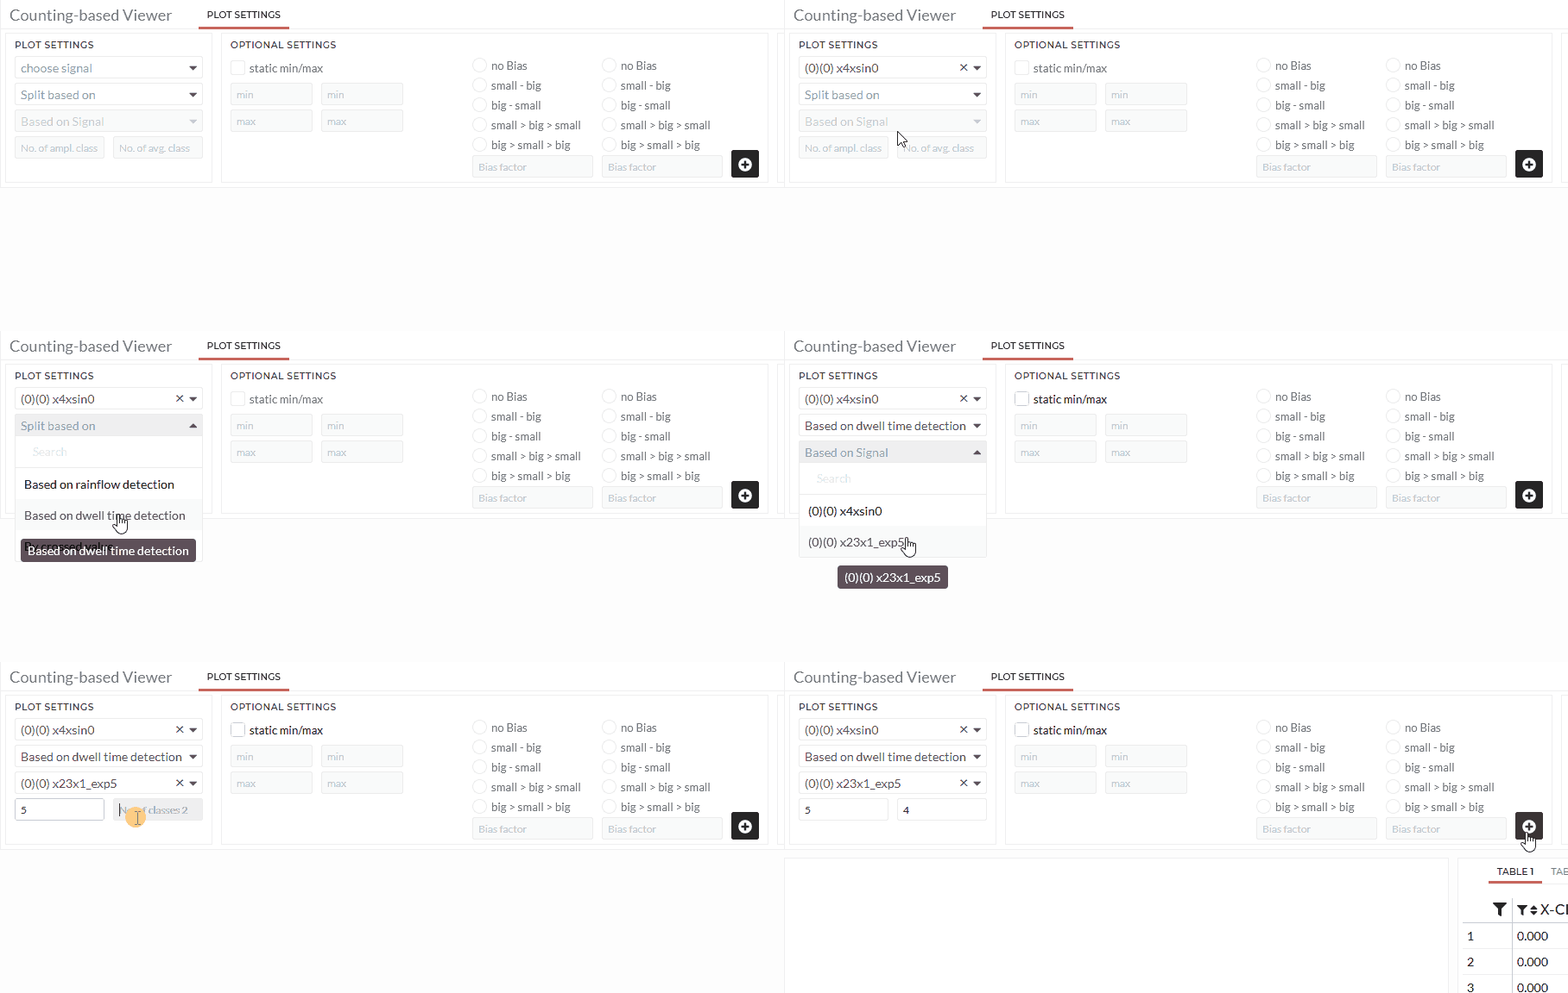
By dwell time detection:
In this option, an m x n matrix is created from two data sets, and each quadrant's frequency is summed up. The average time per quadrant is calculated for time series data instead of the frequency. To learn more about the dwell time algorithm, see - Section 6.2.1 here
- Choose dataset in the choose signals field.
- Select the counting option Based on dwell time detection
- Select the second dataset in Based on Signal.
- Define the number of classes for the selected datasets.
Note: You can specify more options (static min/max or biases) in optional settings.

As a result, you will see a 3d-bar chart. The height of the bars will be the sum of frequency or the total dwell time, and the color will be the average dwell time per quadrant. You will find several tables in different formats with those calculations.
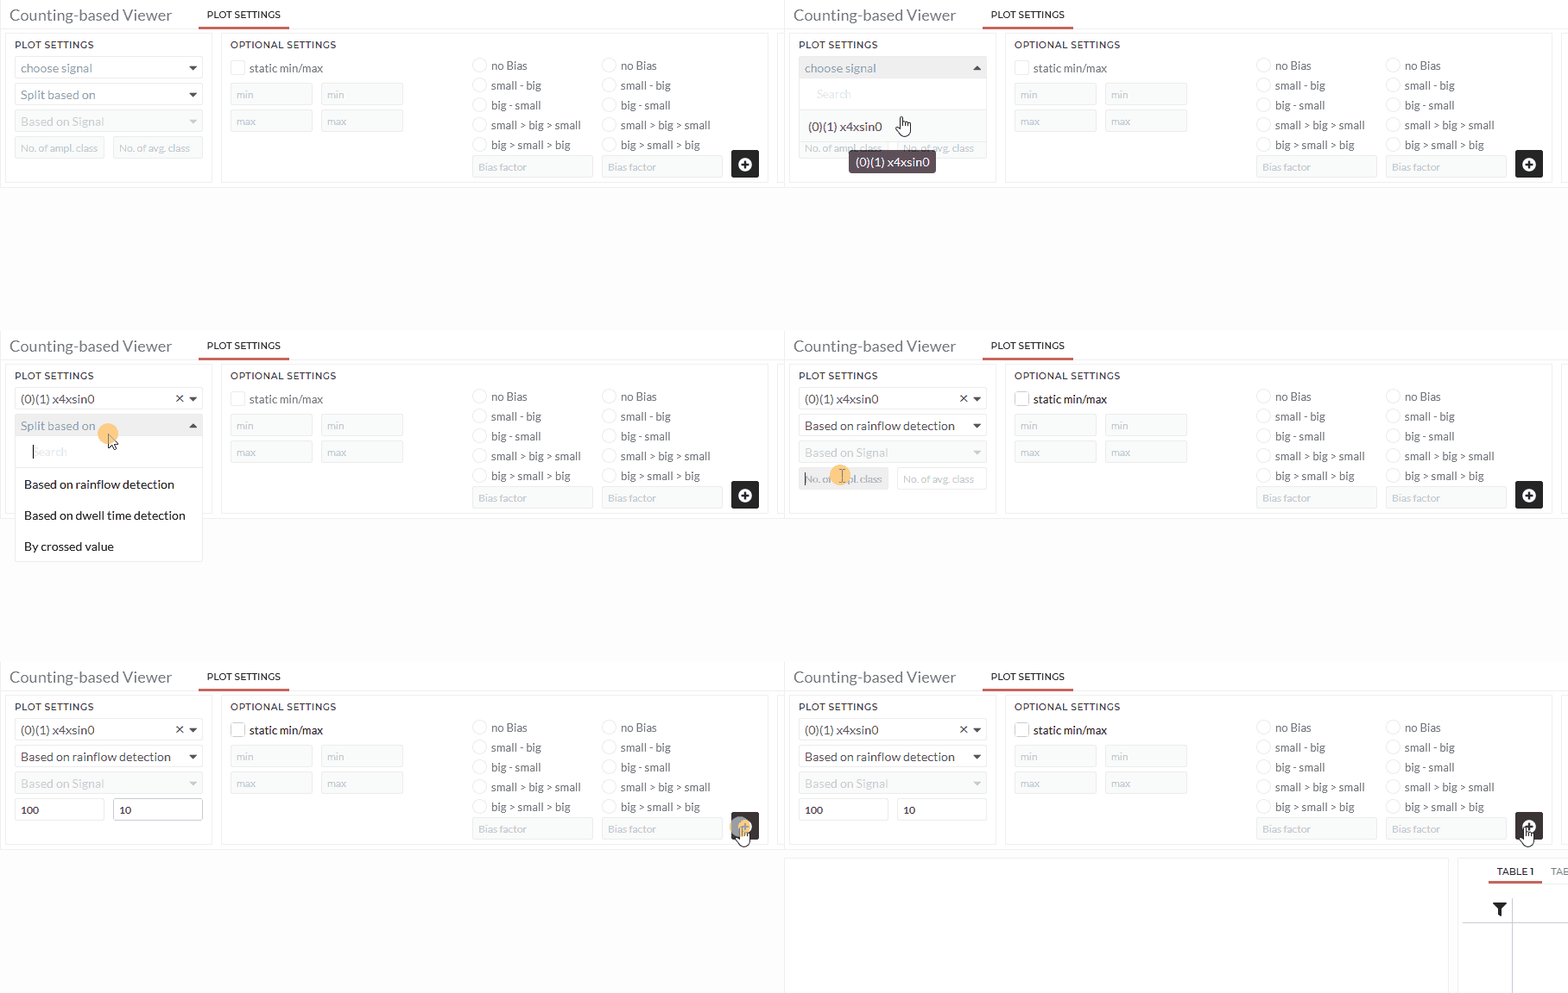
Based on rainflow detection:
The rainflow algorthim will be peformed to detect cycels within the dataset in this option. It is a special two-parameter counting method and is commonly used within fatigue strength.
- Choose dataset in the choose signals field.
- Select the counting option Based on rainflow detection
- Define the number of classes for the amplitude (first input) and the mean-level (second input).
Note: You can specify more options (static min/max or biases) in optional settings.

As a result, you will see a 3d-bar chart. The height of the bars will be the sum of frequency within that specific amplitude and average-level. You will find several tables in different formats with those calculations.