Time-Series Viewer
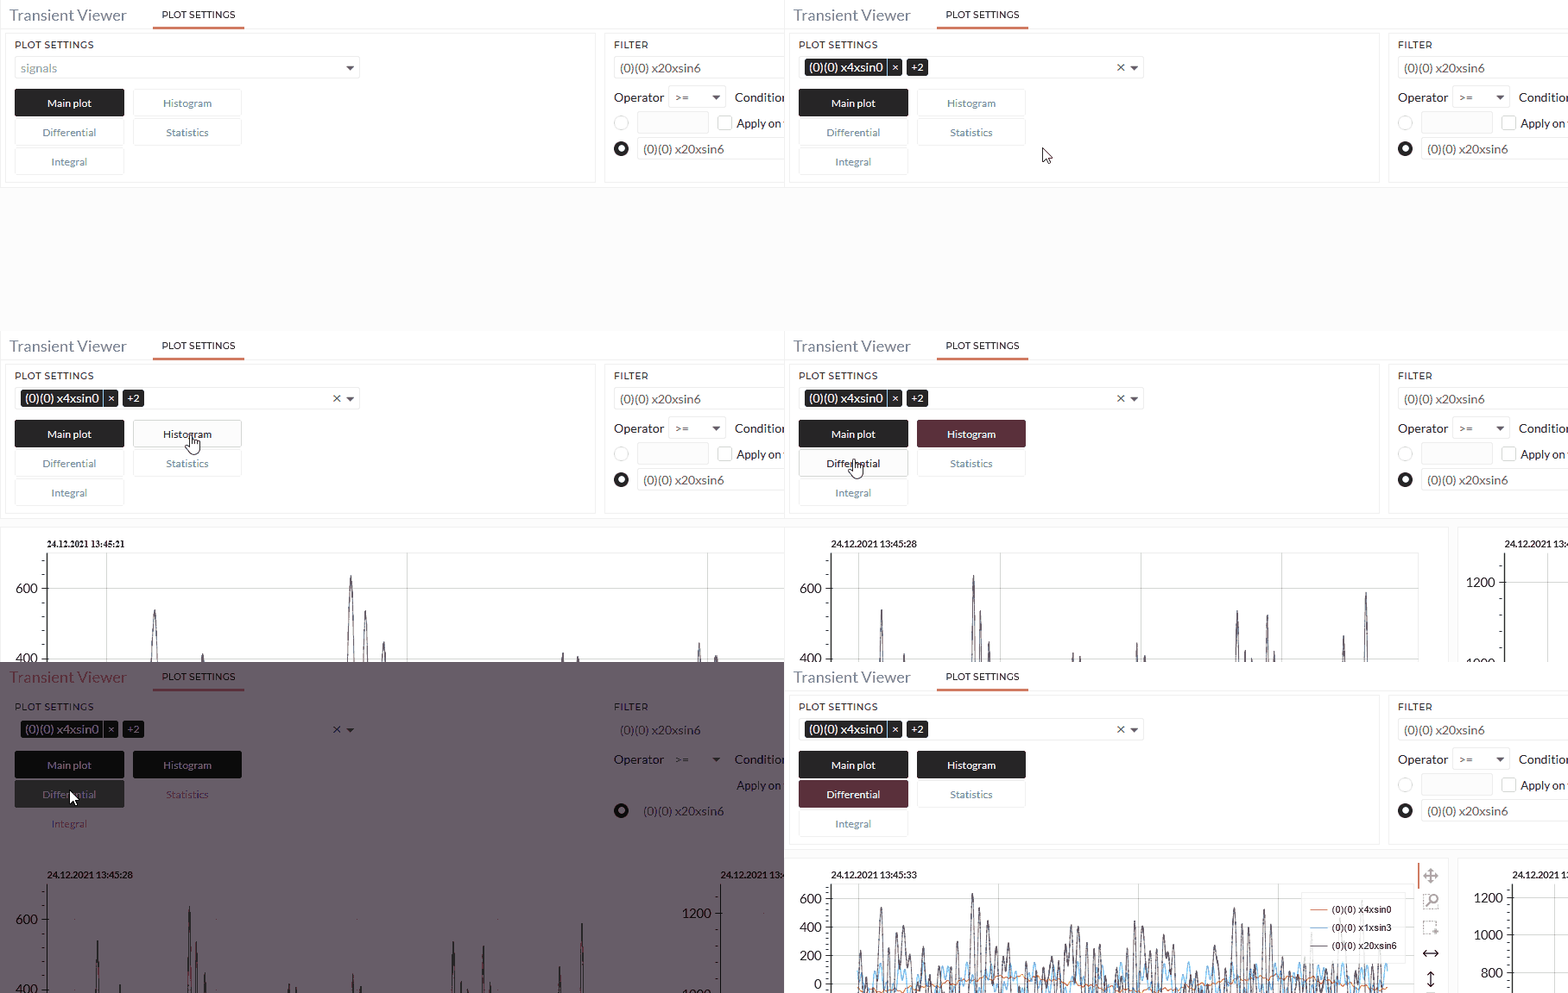
This viewer is specifically designed for time-series data or line plot visualizations. If your data is a time series, it means if it has a corresponding vector, the time/vector will be shown in the x-axis. Integrated operations like differential and integral will respect the correct time axis. In the case of datasets without a corresponding time, the x-axis is just an artificial range from 1 to the length of the dataset. Further details are in the Basic Usage section.
This tutorial assumes that you already selected a project and imported data. For more information please visit on Project and Import Data section.
Basic Usage
The Time-series viewer contains five settings: Main plot, Differential, Integral, Histogram, Statistics. At least of them needs to be activated. Any other combination is possible as long as at least one is activated.
- Choose dataset in the signals field (multi-select possible).
- Activate/Deactive the settings you want.
- Optional: Standardize or Normalize

As a result, you will see one to four plots and one to three tables, depending on your selection. If all options are selected, you will find on the left side all line plots: values over time on the top, the differentials over time in the center, and the integral over time at the bottom. In the center, you find the corresponding histograms and the statistics on the left side.
Filter
In all viewers Tabs, users can select only a part of the data using a Filter. A more detailed description of Filters can be found here